Chapter 6 - Loudness, Sound Pressure and Power


The graph below was produced in Excel
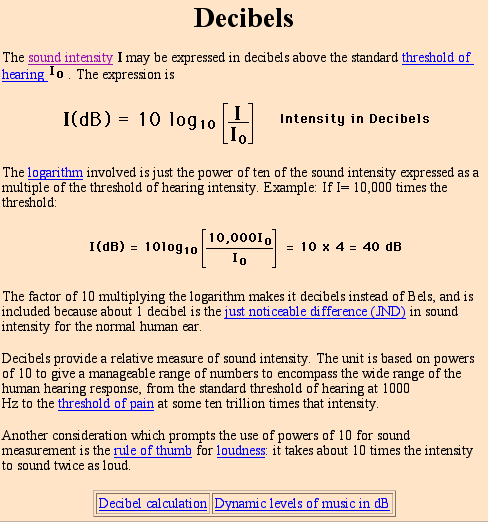
1) Why didn't I use these points --->1, 2, 3. . .999?
2) Use a calculator and plot 7 more points to demonstrate the relationship. (7, 65, 750, 4500, etc.)
3) What would the range of sound pressure levels be, if we did not multiply the log of the ratio of pressures by twenty?
4) What is the difference in magnitude of the ratio of pressures between 87 dB and 57 dB?
5) What is the pressure of a 110 dB sound? How does this compare to atmospheric pressure?
Atmospheric Pressure = 1 bar = 1 atmosphere = 100,000 Pascals = 14.7 lbs/sq.in.


Using
Excel to plot our favorite functions
Survey-25 points
1) On one page, plot the
Lp = 20 x log(ratio of pressures) equation.
2) Use <random numbers in the powers of 10
and the powers of 10> as your ratios of pressures.
3) On the same graph, plot
Lp = 10 x log( ratio of pressures)
4) On the same graph, plot Lp = log(ratio of pressures)
5) Label your axes, title your graph, and use
different colors for the different equations.
6) Print out the table of values the same
sheet of paper.
7) Write a brief explanation why the blue circles
represent the sound pressure levels.


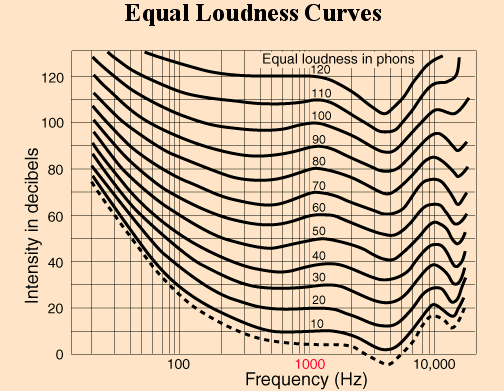
The Equal Loudness Curves
Logarithms, Decibels, Phons and Sones and Noys. . .oh my!
Explain what determines the Loudness of Sounds?
Survey-25 points
1) Simplify the meaning of the terms.
2) Write up (on a computer) an explanation of these terms. This should be a page in length.
3) Use a graph or diagram (pictures are worth a million words).
4) Why does Loudness depend on pressure, frequency, spectrum and duration.
5) Don't put anything on the page that you do not understand.
6) Your classmates or colleagues should be both impressed and helped by your work.
Example I
Example II